Let’s talk about ITSM stats. I’ve said it before and no doubt I’ll say it again (and again) – we love stats and benchmarks in IT. Probably even more than we love IT service management (ITSM) best practice based on my observations of how often different things get shared on social media. Thus, it’s great to see a new HDI report, called “The State of Today’s IT: Process Maturity, Business Alignment, and Digital Transformation,” that – because it’s sponsored – is available to all, and not just HDI members (and without the need to register). If you want to download the report, and its ITSM stats, it’s available here.
If you also want to know what I view as some of the most interesting stats contained within it, then please read on.
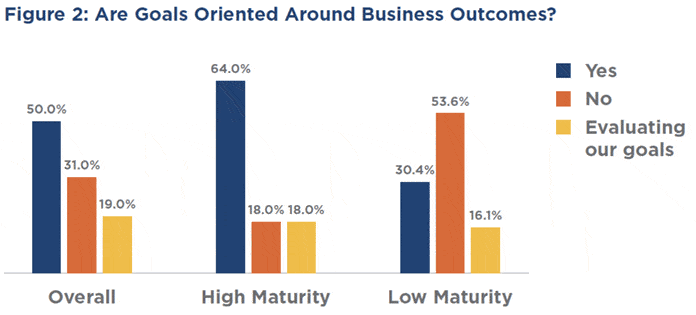
High maturity IT organizations have goals oriented around business outcomes
You might not be surprised by this statement and the first of my selected ITSM stats but:
- It’s great to see a stat actually showing it – because there’s a lot of talk, and things written about, the need for IT organizations to focus on business outcomes not just operational efficiency.
- The stat is a great pointer for any IT department looking to improve; and, probably more importantly, a great hook for them when seeking the additional budget required to improve.
ITSM Stats: Customer satisfaction still isn’t as common a metric as we think
You’d have thought that after all these years – and after all the reports, presentations, and blogs – that customer satisfaction would be right up there as a key metric, or key performance indicator (KPI), along with financial, efficiency, and service-level measures. But, as the HDI ITSM stats chart below shows, fewer than half of respondent organizations measure customer satisfaction; and, very surprisingly, only 52% of high-maturity organizations measure it.
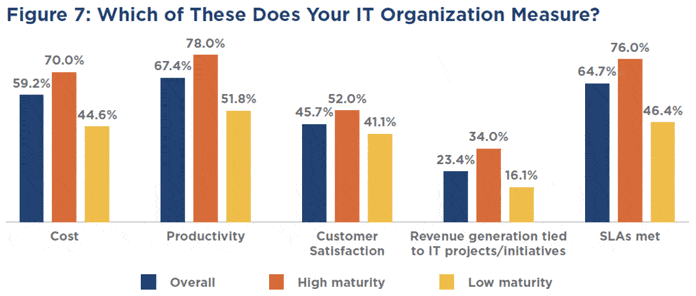
In some ways, one could argue that it’s at odds with the previous stat on business-outcome-based goals (as is the even lower level of revenue generation measurement use). Unless, of course, the high level of service level agreement (SLA)-based measures is assumed to be a reliable proxy of how well IT services and support are meeting business needs and goals?
Even with this reasoning, I’m still surprised at the low level of “interest” in customer satisfaction.
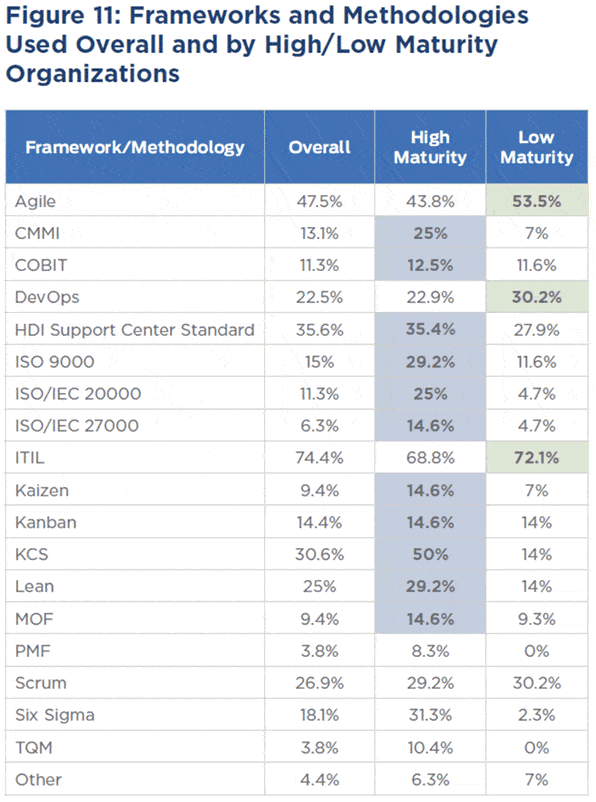
The use of popular ITSM frameworks and methodologies is somewhat counterintuitive
One would think that high-maturity organizations have far more ITSM frameworks and methodologies in play. On the one hand, this is true but, on the other, Figure 11 from the HDI report shows two interesting deviations in its ITSM stats:
- High-maturity IT organizations are the lowest users of ITIL, the most popular ITSM best practice framework – even lower than their low-maturity peers
- DevOps is most popular in low-maturity organizations.
Why? Well it could be due to a number of reasons but I’d offer up the following two, hopefully rational, explanations:
- High-maturity organizations are now operating using a mix, or blend, of ITSM best practices and, while some ITIL best practice remains evident in what they do, they no longer see themselves as ITIL users. You could say that they have “gone beyond ITIL.”
- Low-maturity organizations are trying whatever they can to improve but, like most organizations no matter the maturity, they have limited resources and capacity to try new things. The result is that they go with the most “popular,” and potentially safest, options – ITIL and DevOps.
It’s also worth looking at the adoption levels of the other frameworks and methodologies in the HDI table, two key points for me are:
- The relatively low levels of adoption of some approaches – when you hear or read about them they somehow feel more prevalent. Then there is the gulf between their use in low versus high-maturity organizations.
- The 50% adoption level of Knowledge-Centered Support (KCS) in high-maturity organizations is both interesting and impressive (but please not that survey respondents will be North American in the main).
Enterprise service management adoption continues to grow
It’s been a while since HDI reported on the level of enterprise service management – the use of ITSM thinking, principles, processes, and technology in other lines of business such as human resources (HR) and facilities – adoption. And it’s hard to compare the 2014 enterprise service management and ITSM stats to the new report because respondents were previously asked if they were doing, or planning to do, enterprise service management, not just doing it.
However, the latest HDI stats are a great indicator of how far enterprise service management has spread, particularly in high-maturity IT organizations that are better placed to share what they do. And one can understand the flipside of this – those organizations that rate themselves as low maturity should be reticent about extending what they do to other parts of the business. They would be foolish to do so until their service management capabilities are truly fit to be shared.
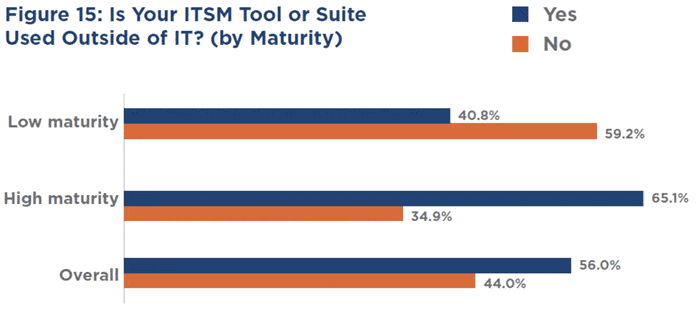
It’s also interesting to note that the 65% high shown above is exceeded by the IT organizations that consider themselves to be business aligned – with 74% of these using their ITSM tool outside of IT.
ITSM Stats The market continues to see ITSM tool churn
Industry surveys often ask the “Do you plan to change your ITSM tool in the next twelve months?” question. So, it’s interesting to see the same issue/opportunity covered from a different perspective in this ITSM stat – the age of the current ITSM tool:
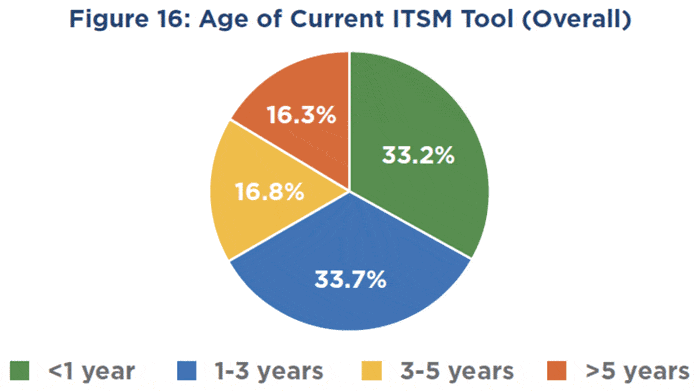
Given that one-third of respondents have invested in a new ITSM tool in the last year, and another third in the last three years (leaving the final third with tools over three years old) – the HDI stat points to ITSM tool churn increasing rather than slowing down. Of course, this could be related to industry-event-defined replacement cycles but a more probable cause is that modern ITSM tools are making it easier for customers to move between vendors and their offerings. With the offered benefits more than just the ability to quickly jump ship when unhappy, for example:
- A more modern user experience (including self-service)
- Newer capabilities
- The ability to receive even newer capabilities more quickly, and
- Easier integrations to other IT and business systems.
So that’s my favorite five ITSM stats from the report. There’s another two dozen stats available (in the report), so please take a look. If and when you do, I’d be interested to know which ones interest and/or surprise you most. Please let me know in the comments section below.
If you liked this ITSM stats article, then the following ITSM articles might be of interest too:
https://itsm.tools/seven-key-ingredients-for-successful-continual-improvement/
Stephen Mann
Principal Analyst and Content Director at the ITSM-focused industry analyst firm ITSM.tools. Also an independent IT and IT service management marketing content creator, and a frequent blogger, writer, and presenter on the challenges and opportunities for IT service management professionals.
Previously held positions in IT research and analysis (at IT industry analyst firms Ovum and Forrester and the UK Post Office), IT service management consultancy, enterprise IT service desk and IT service management, IT asset management, innovation and creativity facilitation, project management, finance consultancy, internal audit, and product marketing for a SaaS IT service management technology vendor.


4 Responses
Thanks for the post, Stephen. I think you are spot on when you are thinking about framework usage, and I’d add this thought: Newer organizations may be less mature, and also may be more likely to use Agile and DevOps as opposed to ITIL.
There’s a lot to pore through in this report–and even more in the raw data.
How did they measure maturity?
As the report states, it’s self-ranking.
The surprise for me is that the overall responses on this question are almost a perfect normal distribution. I expected organizations to rate themselves higher than they did. Combination with the other data (about how they align with business measures, etc.) shows that the more mature self-rated organizations also work more closely with business units and partners.
Great summary Stephen!