
Let’s talk about employee experience data. In my opinion, there should no longer be the need for IT service management (ITSM) articles such as this to tell readers what employee experience is and why it’s important. If you’d like to know, though, then I recommend the introductions to “End-User Experience for IT is Now More Important Than Ever” and “Why Continual Improvement Needs Experience Data.” Instead, there’s a need to build on this knowledge to understand where employee experience is right now, particularly where poor experiences are causing issues to employees and businesses.
To help, this article shares five key insights from The Global IT Experience Benchmark Report™ H2/2021, starting with the relative success of IT touchpoints.
This article shares 5 key insights from the latest edition of @HappySignalsLtd's Global IT Experience Benchmark Report. #ITSM #servicedesk #EX Click To Tweet1. Self-service portals are no longer the least-liked IT touchpoint
In the second half of 2021, the Happiness with Portals increased from -18 to 0, leaving Mobile Devices the lowest scoring of the measured areas at -1.
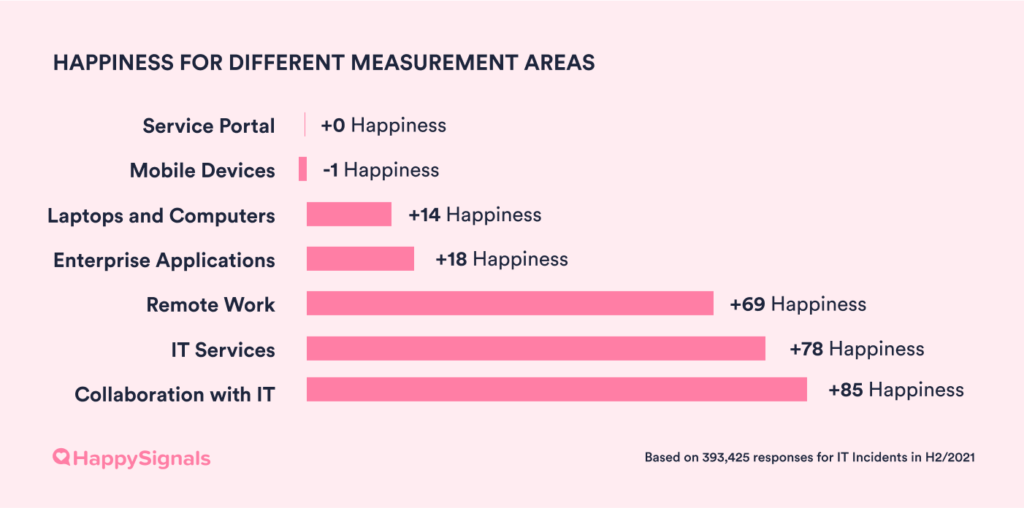
While this jump in Happiness sounds like an accolade, it still leaves Portal as an IT touchpoint with experience-related issues – with this problematic for IT organizations given the increasing levels of Portal use.
This employee experience data (and all of the data points in this article) needs to be viewed in context. It relates to a set of organizations that are already focused on improving experiences (albeit at different points in their improvement journeys). As such, they’re likely to be more positive than for an organization that has yet to adopt an experience management strategy. Hence, no matter how worrying these experience-related data points seem, they’re probably better than the state in an “average” organization.
In the second half of 2021, the Happiness with Portals increased from -18 to 0, leaving Mobile Devices the lowest scoring of the measured areas at -1. #selfservice #servicedesk #EX Click To Tweet2. Comparing self-service portals to other IT support channels
As shown in the chart below, Portal is now the predominant support channel for IT incidents based on the feedback responses received by HappySignals customers – at 38% versus 27% for the telephone channel (and at 56% versus 11% for IT requests).
Given the vogue for “shift-left” strategies and self-service adoption, this growth might seem great, but look at the Happiness and lost time figures below.
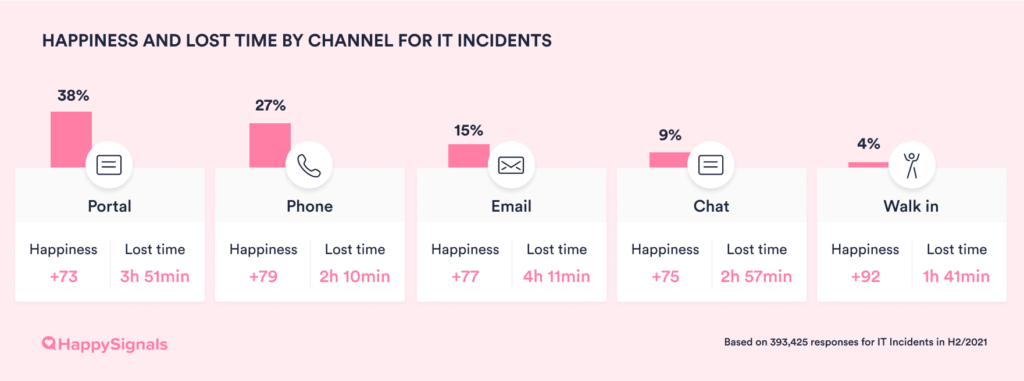
Via this employee experience data, organizations can understand the business-level impact of the Portal-related issues. First, the Portal channel offers the lowest level of Happiness across the support channel mix for IT incidents. Second, despite employees losing less productivity per ticket when using the Portal than the Email channel for the first time in three years, employees still state that they lose 78% more time via Portal use than when using the Telephone channel for incidents. It’s not the immediacy of resolution that self-service promised.
The Self-service portal is now the predominant support channel for IT incidents based on the feedback responses received by @HappySignalsLtd, this may sound great, but the lost time amounted from using #selfservice is NOT. Click To Tweet3. Why there’s a need to look at outcomes over operations
IT is awash with performance measures, particularly the IT service desk. But these focus on the “mechanics” of IT service delivery and support – measuring “how many” and “how long” in the main. It’s why we talk about “watermelon SLAs” where the IT service provider sees a dashboard filled with green while end-users still have issues with IT.
A good example of what’s hidden by using these metrics is the top negative Factor for IT incidents, i.e. the most common reason end-users have had a poor employee experience. Before you shout, “Waiting in a telephone queue!” at your screen, the top negative Factor is “My ticket was not resolved” (closely followed by “Service was slow”).
So, in 2022, please take a much closer look at the outcomes of your IT capabilities, not just your operational performance.
In 2022, please take a much closer look at the outcomes of your IT capabilities, not just your operational performance, says @SamiKallioHki #EX #ITSM Click To Tweet4. Do you have a handle on IT service desk ticket bounces?
The issue of ticket reassignment, i.e. where the end-user is “bounced” between analysts or resolution groups, continues to affect end-users adversely. The H2 2021 employee experience data tells us that every (additional) time a ticket bounces, end-user Happiness falls by close to 8 points, while the end-user loses one hour and 38 minutes more work time.
So, do you know whether your IT service desk is hurting end-user productivity through unnecessary ticket reassignments?
Data from @HappySignalsLtd tells us that every (additional) time a ticket bounces, end-user Happiness falls by close to 8 points, while the end-user loses one hour and 38 minutes more work time #servicedesk #EX Click To Tweet5. Remote-worker support and employee experience data is getting better
Our employee experience data shows that enterprises continue to get better at supporting employees in Remote Work.
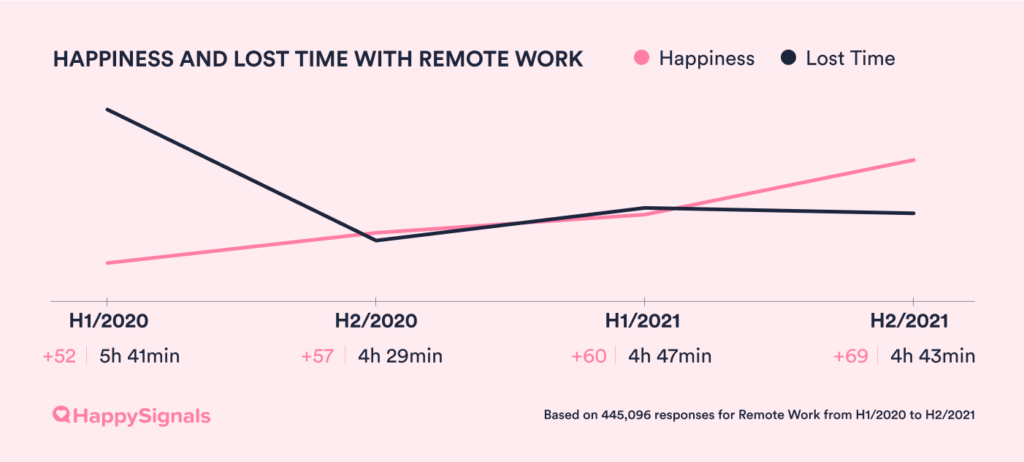
As shown above, end-user Happiness with Remote Work increased from 57 to 69 in 2021, although lost productivity increased slightly.
However, our data also shows that it’s challenging to generalize remote or hybrid worker experiences, with no factors standing out as the dominant influences on positive or negative Remote Work experiences.
Hence, collecting employee experience data from your organization’s remotely working employees will be the only way to ensure that corporate capabilities are sufficient to make them happy and productive.
According to @HappySignalsLtd end-user Happiness with Remote Work increased from 57 to 69 in 2021, although lost productivity increased slightly. #servicedesk #EX #ITSM Click To TweetGetting access to employee experience data and insight benchmarks
As already stated, these data points and insights are based on the information collected by the customers using the HappySignals IT Experience Management Platform – almost 750k pieces of end-user feedback were collected between July and December 2021.
Our customers include large enterprises and public sector organizations as well as Managed Service Providers (MSPs) around the globe – the latter of which use the HappySignals Platform with their customers. Such that, in addition to the top-level aggregated employee experience data, we can see IT’s performance through multiple lenses such as geography, industry, company size, and even whether the corporate IT service desk is internal or outsourced.
For example, the average end-user Happiness uplift from first the two months of using HappySignals until H2/2021 is:
- 56 to 74 (a 33% increase) for customers with an outsourced IT Service Desk
- 76 to 84 (an 11% increase) for customers with an internal IT Service Desk.
To learn more about this and other employee experience data and insights, you can read The Global IT Experience Benchmark Report™ H2/2021 here or watch this video to get the highlights.

Sami Kallio
Sami Kallio is the CEO of HappySignals, a company focused on helping businesses to improve their internal services by shifting the focus from traditional metrics to employee experience - by measuring and analysing employee happiness and productivity. Sami says:” I believe that enterprises should no longer try to save more money from support services. Rather that organizations should put more focus on business value. At HappySignals we help organizations to measure and understand their employees' experience and productivity in a new way."
