
We’ve released our latest experience management snapshot for IT service management (ITSM) – The Global IT Experience Benchmark: Full Year 2023. This new benchmark report analyzes the experience-focused responses our customers received from their 1.86 million IT end-users across 130 countries. As always, the aggregated customer data provides many interesting and important insights into how well internal and external IT service delivery and support organizations serve their customers’ end-users and where changes need to be made.
The latest experience management snapshot for #ITSM from @happysignalsltd provides many interesting insights into how well internal & external IT service delivery & support orgs serve their customers’ end-users. See more here. Share on XThe data insights can be used as the baseline for experience management in 2024. However, it should be appreciated that the experience data collected from our customers reflects a spectrum of experience management “positions.” Each customer is likely at a different point in their experience management journey. Plus, the data will likely paint a better picture than the current state of any IT organization (internal or outsourced) that hasn’t started to measure and improve its experiences.
The region-based analysis, in particular, shows how valuable organization-specific experience management data is in focusing improvements on what matters most to employees. Related insights are shared below.
How the experience management data is gathered
Before sharing some of the benchmark report’s insights, it’s essential to understand how this experience management data is collected.
Our customers are large organizations, with 1000-350,000 employees. They use the HappySignals IT Experience Management platform to gather experience data through continuous surveys related to resolved IT tickets and proactively across various IT areas. These surveys measure end-user happiness and the employees’ estimated productivity loss. The survey respondents also identify the factors, or experience indicators, that affect their experiences.
Experience Management: The Overall IT Experience
In terms of non-ticket-based experience management insights, the chart below shows the Overall IT Experience for 2023. This measure is a “regular pulse,” not just an annual check, of the general sentiment of end-users toward IT services and the time people think they lose each month because of IT-related issues.
Report findings from @happysignalsltd: Corporate devices & applications have the lowest happiness scores, incurring significant time loss (especially Enterprise Applications at close to 5.5 hours per month). See more here. #ITSM #EX Share on X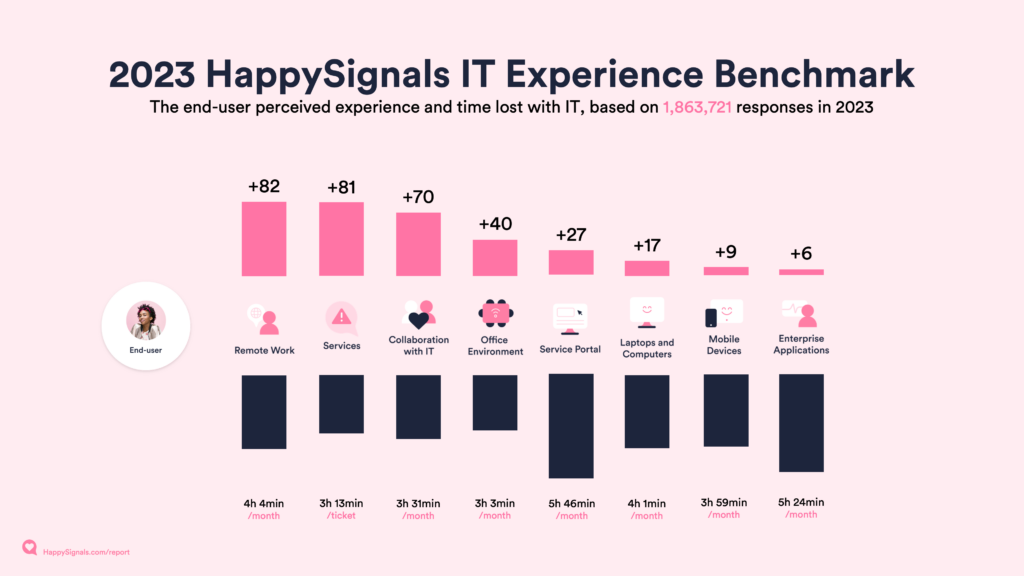
The average Overall IT Experience score in 2023 (for our customers) was +39, up five points from 2022. The key experience management insights from this aggregated data include the following:
- Corporate devices and applications are still problematic (they have the lowest happiness scores), with these three areas all incurring significant time loss (especially Enterprise Applications at close to 5.5 hours per month).
- While not solely related to IT, despite employees thinking they lose more time with Remote Work than Office Environment-related issues, Remote Work is still rated +42 points higher than the Office Environment.
- The Service Portal experience has dropped slightly from +32 in 2022 to +27 and is perceived as the highest cause of employee lost time.
Understanding geographical experience differences is important
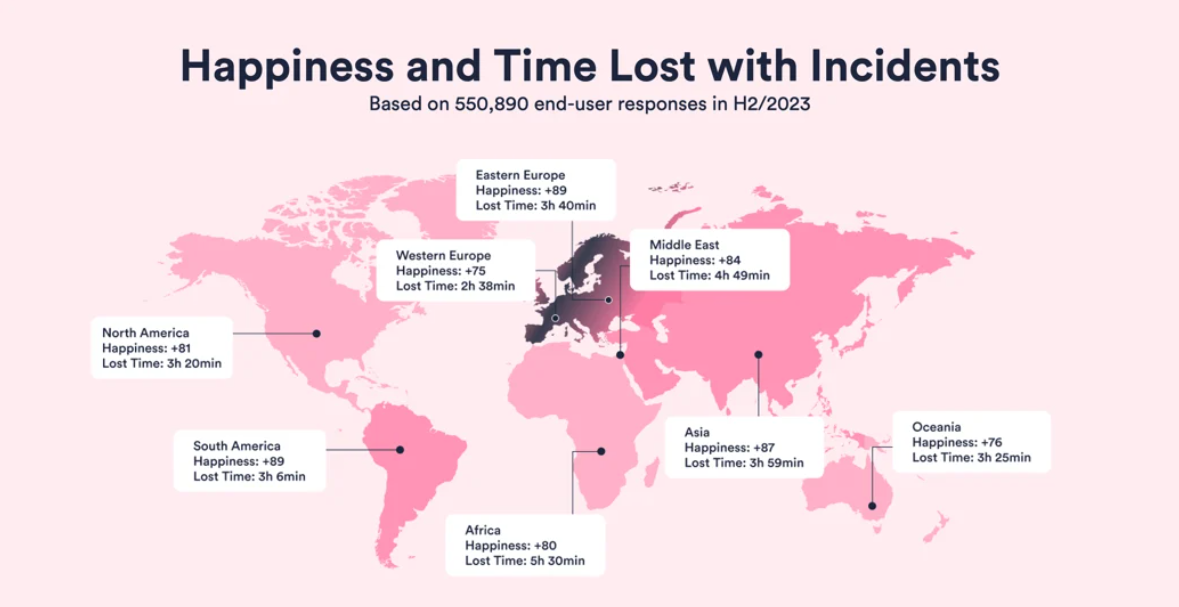
The level of happiness and time lost with incident handling is a good example of how end-users in different regions perceive their experiences. The chart below shows that Western Europe and North America view their IT support experiences significantly differently.
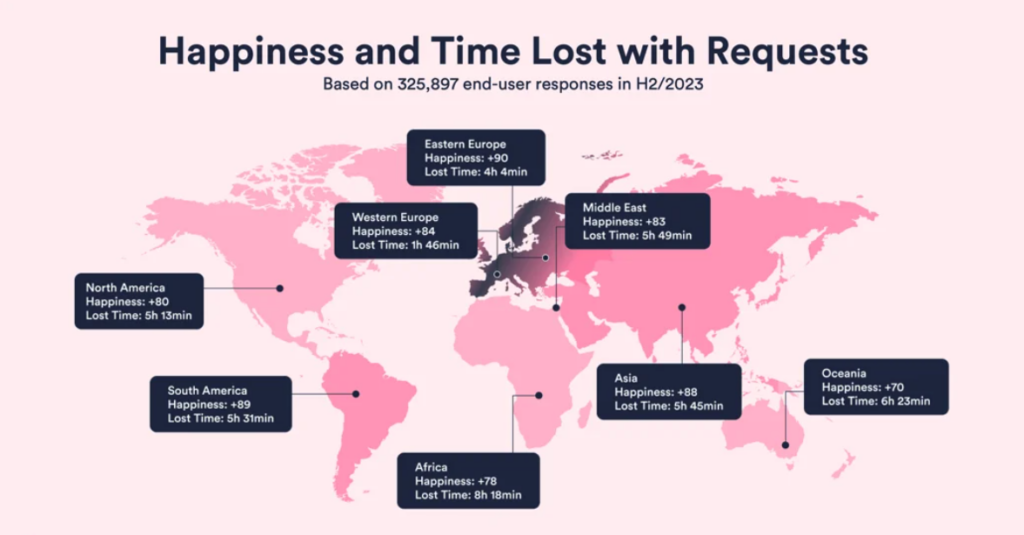
The cause(s) of the Western Europe and North American (and other) incident handling experience differences is currently unknown. However, request handling experience management data shows a different perspective (as shown below), with North American end-users scoring request handling four points lower (+80) than Western Europeans (+84) and perceiving themselves to lose 3.5 hours more per request.
Did you know that Western European end-users are the most critical of IT support despite losing less time (2h 38min) than all the other regions? Read more from the @happysignalsltd report here. #ITSM #EX Share on XWestern European end-users are the most critical of IT support despite losing less time (2h 38min) than all the other regions. Meanwhile, North American end-users score incident resolution six points higher (+81) despite losing almost an hour’s more work time per incident than Western European end-users.
Geography also impacts the end-user profile mix
HappySignals’ experience management research has identified four IT support profiles:
- Doers solve issues themselves using self-help tools and will often help colleagues
- Prioritizers, while familiar with IT, don’t want to use their time for IT issues and expect the IT service desk to help
- Supported are uncomfortable with technology, unwilling to read instructions, or don’t want to use self-service capabilities
- Triers try to fix their IT issues but usually can’t; they want personal help and to learn from it.
As with the reported experiences, the end-user profile mix differs significantly across regions, as shown in the chart below.
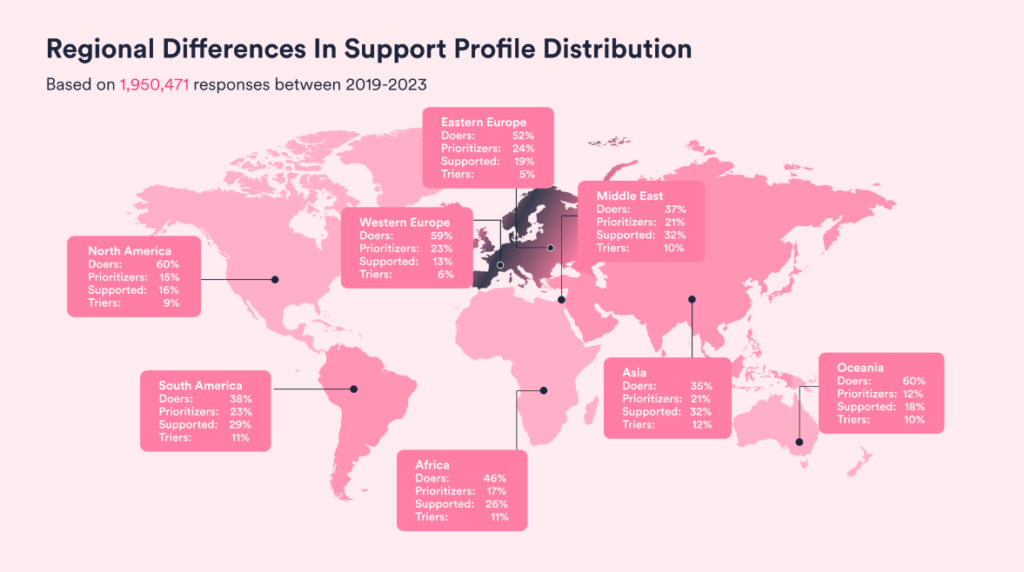
So, for example, while Doers represent 55% of all end-users, they are much less common in Asia, the Middle East, and South America. However, this is not solely a representation of culture. Instead, the variances can show differences in the work undertaken in different parts of the world.
For example, while a company is a multinational organization, the headquarters are still likely located in Western Europe or North America. Hence, some locations have a majority of office workers, while others have fewer.
All of this must be factored in when improving experiences in different regions. As the article title states, with experience management, “the devil is in the… data.”
The company industry affects experience management, too
The benchmark report’s aggregated customer data also highlights industry-based differences in experience, as shown in the incident handling chart below.
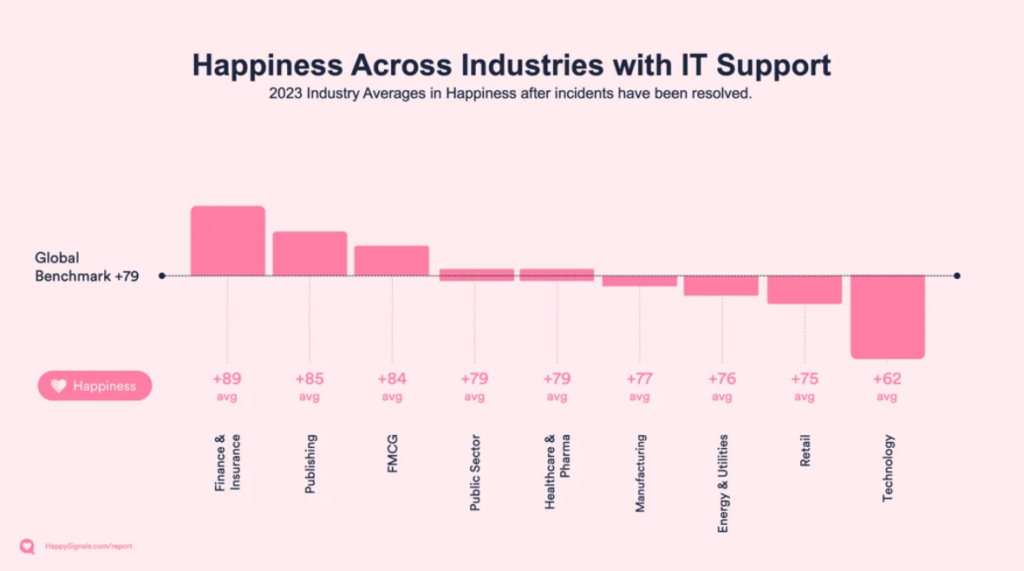
End-users in the financial and insurance sectors report higher satisfaction. However, in the technology industry, despite the corporate focus being centered around technology, end-users report the lowest levels of happiness and the longest wait times.
These experience management differences, in part, relate to the aforementioned end-user profile mix. For example, public sector employees are often self-sufficient “Doers,” preferring to self-solve their problems. While retail has more “Prioritizers” – these people are skilled yet choose to delegate to IT support specialists. The “Supported” profile is most evident in the FMCG industry, and “Triers” are slightly more common in FMCG and Healthcare and Pharma.
Ultimately, though, understanding these industry-based differences is a high-level view. No matter the industry, the differences within a company’s roles and locations will likely present even greater variations.
What this means for your organization
While an organization’s focus on experience management is commendable (and increasingly an ITSM imperative), hopefully, these shared insights highlight the importance of corporate-specific experience data and the analysis of it to ensure that the right insights are understood, prioritized, and acted upon. Returning to the article’s title, with experience management, the “devil is in the… data.”
You can access the full HappySignal Benchmark Report here.
Further Reading
If you enjoyed this experience management article, you may also enjoy some of the related IT service desk articles listed below.
Please use the website search capability to find more helpful ITSM articles on topics such as customer journeys, improving business processes, customer-based planning, data integration, how to continue improving experiences, hardware and software issues, IT asset management (ITAM), user experience, handing different types of data, software developer roles, data models, IT support teams, developing team members, and making informed decisions.

Sakari Kyrö
Sakari Kyrö sees himself as an analytical and curious optimist. He holds a M. Sc. in economics, but has since his teenage years been more interested in psychology and technology.
When he got his first radio cassette player for Christmas as a little boy, his first task was to take it apart to see what was inside. The same curiosity for the inner workings of things has now led him to work at HappySignals, trying to understand how enterprise IT could become more human-centric all the while being a win-win for the people of the business, as the business itself.
