
Service availability or availability management really matters for business goals and continual or continuous improvement. When services that a customer expects to be able to access aren’t available, that customer is going to be unhappy. It’s the unfortunate bottom line.
After all, why should the customer pay for a service that isn’t there when they need it? This, of course, is why an agreed measure of service availability is so often a key performance indicator (KPI) in IT service management (ITSM) performance metrics.
IT staff often work very hard to meet the agreed target. And they report figures to customers to prove it has been met. Typically, IT organizations use a percentage, such as 99.999% service availability, to do this.
Unfortunately, this sometimes means that IT service organizations focus on the percentage measure. And lose sight of their true goal – providing value for customers. Please keep reading to understand more, including some examples.
Understanding the Limitations of Percentage-Based Service Availability
Organizations can view availability in real time. However, a simple service availability definition is the percentage of time your service is available. One of the simplest ways to calculate it is based on two numbers. You might remember this from your ITIL training and availability management.
You agree on the amount of time that the service should be available over the reporting period. This is the service availability or agreed service time (AST). You measure any downtime (DT) during that period. You take the downtime away from the agreed service time, with this expressed as a percentage.

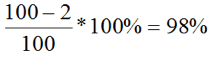
In terms of service availability examples, if AST is 100 hours and downtime is 2 hours, then the availability is:
The Trouble with Simple Uptime Percentages
The trouble with this is that, while this service availability calculation is easy enough to perform, and collecting the data to do it seems straightforward. It’s really not at all clear what the number you end up with is actually telling you. I’ll go into a bit more detail about this later in the blog.
Why Customers Care About Service Experience, Not Just Numbers
Worse still, from the customer’s point of view, you may be reporting that you have met agreed service availability goals. But the customer is totally unsatisfied with the user experience or customer experience (internal and external customer satisfaction).
Customers are only interested in percentage service availability insofar as it correctly identifies their ability to use IT services to support business processes. A blanket percentage figure is probably not going to do that. A meaningful report needs to be based on measurements that describe things the customer cares about. For example, the ability to send and receive emails, or to withdraw cash from ATMs.
Defining Meaningful Service Availability Targets
If you want to measure, document, and report service availability in ways that will be helpful to your organization and customers you need to do two things. Firstly, you need to understand the context. To do this you’ll need to talk to your customers about availability needs and availability monitoring.
Secondly, you need to think very carefully about a range of practical issues. What will you measure, how will you collect your data, and how will you document and report your service availability findings?
Identifying Critical Business Functions
Before you do anything else, you need to work out what your customers need service availability for. And what impact the loss of service availability has on them. This will allow you to agree realistic goals that consider technology (perhaps even specific configuration items), budgetary, and staffing constraints.
In other words, you need to talk to your customers to ensure you understand what they need in terms of service availability. And if necessary, to help them understand that “I want it to be available all the time” is probably going to cost more than it’s worth.
Prioritizing What Matters Most to the Customer
But what exactly should you be talking to your customers about? An excellent starting point is the impact of downtime. Here are five service availability or availability management questions you should consider asking:
- Which of your business functions are so critical that protecting them from downtime is a priority?
- How does the length of any downtime affect your business?
- How does the frequency of downtime affect your business?
- What impact do service availability and downtime have on your organization’s productivity and customers?
Critical business functions
Most IT services support several business processes. Some of these are critical and others are less important in service availability terms. For example, an ATM may support cash dispensing and statement printing. The ability to dispense cash is critical, but if the ATM can’t print statements this has a much lower impact.
You need to talk to your customers about service availability and reach an agreement on the importance of the various functions to their business. You may find it helpful to draw up a table that indicates the business impact that follows losing each of these functions relative to one another. Table 1 is an example:
Table 1 – Percentage degradation of service
| IT function that is not available | % degradation of service |
|---|---|
| Sending email | 100% |
| Receiving email | 100% |
| Reading public folders | 50% |
| Updating public folders | 10% |
| Accessing shared calendars | 30% |
| Updating shared calendars | 10% |
NB: Figures are not intended to add up to 100%
It’s clear from this table that the service has no value at all if it cannot send and receive emails. And that the value of the service is reduced to half its normal level if public folders cannot be read. This tells the IT organization where to focus their service availability efforts when designing and managing the email service.
Evaluating Downtime: Duration, Frequency, and Impact
You need to find out how the customer’s business is affected by both the frequency and the duration of downtime. I’ve already mentioned that percentage service availability may not tell you enough to be of value.
When a service that should be available for 100 hours has 98% service availability, there were two hours of downtime. But this could mean a single two-hour incident, or many shorter incidents. The relative service availability impact of a single long incident or many shorter incidents will be different, depending on the nature of the business and the business processes involved.
Why Two Hours of Downtime Isn’t Always Equal
For example, a billing run that takes two days to complete and must be restarted after any outage will have its service availability seriously impacted by every short outage. But one outage that lasts a long time may be less significant. On the other hand, a web-based shopping site may not be impacted by a one-minute outage. But after two hours the loss of customers could be significant.
Once you know the likely impact, you’re in a much better position to:
- Put in place infrastructure, applications, and processes that will really support the customer
- Devise meaningful targets
- Find ways of documenting and reporting the service availability appropriately.
Here’s an example of how you could measure service availability to reflect the fact that the impact of downtime varies:
Table 2 – Outage duration and maximum frequency
| Outage duration | Maximum frequency |
|---|---|
| Up to 2 minutes | 2 events per hour 5 events per day 10 events per week |
| 2 minutes to 30 minutes | 2 events per week 6 events per quarter |
| 30 minutes to 4 hours | 4 events per year |
| 4 hours to 8 hours | 1 event per year |
If you use a table like this when you’re discussing the frequency and duration of downtime with your customers, the numbers are likely to be much more useful than percentage service availability, and they’ll certainly be more meaningful to your customers.
Linking Downtime to Productivity and Business Impact
I’ve said that percentage service availability is not very useful for talking to customers about downtime. In contrast, when you discuss the impact of downtime on productivity, percentage impact can be a very useful measure indeed.
Most incidents don’t cause complete loss of service for all users. Some users may be unaffected, while others have no service at all.
At one extreme, there may be a single user with a faulty PC who cannot access any services. You might class this as 100% loss of service. But this would leave IT with a totally unrealistic goal, and would not be a fair measurement of service availability.
At the opposite extreme, you might decide to say that a service is available so long as someone can still access it. However, you don’t need much imagination to understand how customers would feel if service availability is being reported while many people just can’t access it.
How to Measure Lost User Minutes or Transaction Impact
One way you can quantify service availability impact is to calculate the percentage of user minutes that were lost. To do this:
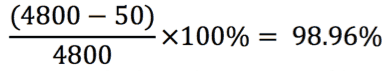
- Calculate the PotentialUserMinutes. This is the total number of users times the length of time that they work. For example, if you have 10 staff who work for 8 hours then the PotentialUserMinutes is 10 x 8 x 60 = 4800
- Calculate the UserOutageMinutes. This is the total number of users who were not able to work, multiplied by the time they were unable to work. For example, if an incident prevented 5 people from working for 10 minutes then the UserOutageMinutes is 50.
- Calculate the percentage service availability using a very similar formula to the one we saw earlier

In this example, you would calculate the service availability as:
You can use this same technique to calculate the impact of lost service availability of IP telephony in a call center in terms of PotentialAgentPhoneMinutes and LostAgentPhoneMinutes. For applications that deal with transactions or manufacturing, you can use a similar approach to quantify the business impact of an incident. You compare the number of transactions that would have been expected without downtime to the number of actual transactions. Or the amount of production that you would have predicted to the actual production.
How to Measure and Report Service Availability Effectively
After you’ve agreed and documented your service availability targets, you need to think about practical aspects of measuring and reporting availability. For example:
- What will you measure?
- How will you collect your service availability data?
- How will you document and report your findings?
Choosing the Right Metrics and Data Collection Methods
It’s essential to measure and report service availability in terms that can be compared to targets agreed with customers. And that are based on a shared understanding of what the customer’s service availability needs actually are. The targets need to make sense to the customer, and to ensure that the IT organization’s efforts are focused on the customer’s business needs.
Usually, the targets will form part of a service level agreement (SLA) between the IT organization and the customer. But be careful that meeting numbers in an SLA does not become your goal.
The numbers in the SLA are simply agreed ways of measuring. The real goal is to deliver services that meet your customers’ needs (and this includes service availability). For example, with IT self-service.
Common Techniques for Measuring Service Availability
There are many different ways that you could collect data about service availability. Some of these are simple, but not very accurate, others are more expensive. You may want to focus on just one approach, or you may need to combine some of these to generate your reports.
Using Service Desk Data
One way to collect service availability data is via the service desk. Service desk staff identify the business impact and duration of each incident as a routine part of managing incidents. You can use this data to identify the duration of incidents and the number of users impacted.
This approach is generally fairly inexpensive. However, it can lead to disputes about the accuracy of the service availability data.
Monitoring Infrastructure and Applications
This approach involves instrumenting all the components required to deliver the service and calculating service availability based on understanding how each component contributes to the end-to-end service.
This can be very effective, but may miss subtle failures, for example a minor database corruption could result in some users being unable to submit particular types of transaction. This service availability method can also miss the impact of shared components, for example one of my customers had regular downtime for their email service due to unreliable DHCP servers in their HQ, but the IT organization did not register this as email downtime in their calculation.
Employing Dummy Clients
Some organizations use dummy clients to submit known transactions from particular points on the network to check whether the service is functioning. This does actually measure end-to-end service availability.
Depending on the size and complexity of the network this can be quite expensive to implement, and it can only report the service availability from the particular dummy clients. This means that subtle failures may be missed, for example if a change means that clients running a particular web browser no longer work correctly, but the dummy clients use a different browser.
Tools that support this data collection often report service performance, as well as service availability, and this can be a useful addition.
Instrumenting Applications for Real-Time Insights
Some organizations include code in their applications to report end-to-end service availability. This can actually measure end-to-end service availability, provided that the requirement is included early in the application design. Typically, this will include code in the client application as well as on the servers.
When this is done well it can not only collect end-to-end service availability data, but it can also identify exactly where a failure has occurred, helping to improve availability by reducing the time needed to resolve incidents.
Reporting Service Availability to Customers
When you have collected service availability data, you need to consider how this should be reported to customers.
Handling Planned Downtime Fairly in Reports
One aspect of service availability measurement and reporting that’s often overlooked is planned downtime. If you forget to factor in planned downtime when you’re working out how to report service availability, you could end up reporting availability figures that don’t fairly reflect your service provision.
There are several ways to make sure that planned downtime doesn’t accidentally end up inflating the service availability statistics. One is to have the planned downtime happen during a specific window that’s not included in availability calculations. Another is to schedule planned downtime. For example, some organizations may not count downtime that has been scheduled a month in advance.
Whatever you decide to do with service availability, it’s important that your SLA clearly defines how planned downtime will be reported for management systems.
Setting Reporting Periods That Reflect True Service Availability Performance
Earlier in this blog, I talked about the limitations of percentage service availability as a useful measure. Nevertheless, it does have its uses and it continues to be widely used. So, it’s important to understand that you need to specify the time period over which calculation and reporting take place, as this can have a dramatic effect on the service availability numbers that you’ll be reporting.
For example, let’s consider an IT organization that has agreed a 24×7 service and service availability of 99%. Suppose there’s an eight-hour outage:
- If we report service availability every week then the AST (Agreed Service Time) is 24 x 7 hours = 168 hours
- Measured monthly the AST is (24 x 365) / 12 = 730 hours
- Measured quarterly the AST is (24 x 365) / 4 = 2190 hours
Putting these numbers into the availability equation gives:
- Weekly service availability = 100% x (168 – 8) / 168 = 95.2%.
- Monthly service availability = 100% x (730 – 8) / 730 = 98.9%
- Quarterly service availability = 100% x (2190 – 8) / 2190 = 99.6%
Each of these is a valid figure for service availability, but only one of them shows that the target was met.
Conclusion
Almost every IT organization that I’ve worked with measures and reports service availability. The really great IT departments work with their customers to optimize their investment and deliver levels of service availability that delight. Sadly, many IT organizations focus on the numbers in an SLA, and completely fail to meet their customers’ needs – even if they deliver the agreed numbers.
In this article, I’ve offered a number of suggestions for how you can measure and report service availability, but I haven’t discussed what you can do to help manage and improve it. This is probably even more important, but it’s a topic for another article. As is disaster recovery planning!
What else would you add to my service availability advice? Where do you need help, perhaps with service delivery? Please comment below.
Stuart originally wrote this service availability article in 2017 with it updated in 2026.
Frequently Asked Questions: Service Availability Measurement and Reporting
Service availability refers to the degree to which an IT service is operational and accessible when users need it. It is typically expressed as a percentage over a defined time period, such as monthly or annually.
Availability is usually calculated using the formula:
(Agreed service time – downtime) ÷ Agreed service time × 100.
This measures how much time a service was available compared to the total expected service time.
Downtime includes any period when a service is unavailable or does not perform as agreed. This can include unplanned outages, system failures, and sometimes planned maintenance, depending on how the service level agreement (SLA) defines it.
Uptime is a raw measurement of how long a system is running, while availability is a broader service metric that considers agreed service hours, SLAs, and what “usable service” actually means for the business.
Service availability is a key indicator of IT service reliability and directly impacts user experience, productivity, and business operations. It is also commonly tied to SLAs and contractual obligations.
A service level agreement (SLA) defines the expected level of service, including availability targets such as 99.5% or 99.9%. It also specifies how availability is measured and what is included or excluded from downtime.
Availability is typically reported monthly, but high-criticality services may be monitored and reported more frequently, such as weekly or in real time via dashboards.
There is no universal “good” target. It depends on the service’s criticality. For example, customer-facing or revenue-generating services may require 99.9% or higher, while internal systems may have lower targets.
Availability is usually measured using IT monitoring tools, ITSM platforms, application performance monitoring (APM) tools, and infrastructure monitoring systems that track uptime, incidents, and outages.
Effective reporting includes clear metrics, trends over time, root-cause insights for downtime, SLA compliance status, and business-impact context. Visual dashboards are often used.
Availability measures whether a service is accessible when needed, while reliability focuses on how consistently a service performs without failure over time.
This depends on the SLA definition. Some agreements exclude planned maintenance if it is communicated in advance, while others include all downtime regardless of cause.
Monitoring tools detect outages, performance issues, and service degradation in real time. This data is essential for calculating accurate availability metrics and triggering incident response.
Low availability directly affects user experience by preventing access to services, reducing productivity, and potentially causing frustration or loss of trust in IT services.
Common mistakes include unclear definitions of downtime, inconsistent measurement periods, ignoring partial outages, and failing to align technical metrics with business service definitions.
End-to-end availability measures the availability of the complete service as experienced by the user, not just individual components like servers or networks.
ITIL defines availability as the ability of a service or component to be operational and accessible when required. It emphasizes business alignment and measurable outcomes rather than just technical uptime.
It helps IT teams demonstrate performance, meet SLA commitments, identify recurring issues, improve infrastructure reliability, and make data-driven improvement decisions.
Yes. Availability can be improved through better monitoring, redundancy, proactive incident management, infrastructure resilience, automation, and addressing root causes through problem management.
Availability is one of the most common SLA metrics. Meeting or exceeding availability targets is often a contractual requirement between IT service providers and business stakeholders.
Further Reading
If you liked this service availability article, then the following ITSM articles might be helpful too:
If you can’t find anything helpful here, please use the site’s search capability to find more interesting ITSM articles on topics such as ITSM processes, emerging information technologies, asset management, email address management, user-friendly UI design, unplanned downtime, high-level performance metrics, mobile app management, configuration manager responsibilities, ITSM tools, email account management, reducing human error with automation, reducing lost productivity, and long-term service level management.

Stuart Rance
Stuart Rance is a consultant, trainer, and author with an international reputation as an expert in ITSM and information security. He was a lead architect and lead editor for ITIL 4, and the lead author for RESILIA™: Cyber Resilience Best Practice. He writes blogs and white papers for many organizations, including his own website.
Stuart is a lead examiner for ITIL, chief examiner for RESILIA, and an instructor for ITIL, CISSP, and many other topics. He develops and delivers custom training courses, and delivers presentations on many topics, for events such as itSMF conferences and for private organizations.
In addition to his day job, he is also an ITSM.tools Associate Consultant.

12 Responses
Here is my example of defining service availability in business terms;
Business – say 500 retails shops across country, each shop has 3 cash registers to service shoppers.
Service name = Retail service
Value proposition = Retail service facilitates easy, fast and satisfying processing of customer sales in the shops. Value is created when every customer transaction is quickly processed, thereby avoiding lengthy queue at cash register, and therefore prevents money walking out the door.
Fact 1 = During peak hours, if one of 2 registers are down, queues are longer at remaining 2 and many customers walk out without buying because of time constraints
Suggested definition of service availability = During peak hours if any of the three cash registers is down, we will consider the entire retail service is down, SLA breach is incurred and downtime is accumulated.
During non peak hours if any two of the cash registers are down, we will consider the entire retail service is down, SLA breach is incurred and downtime is accumulated. If only one cash register is down retail service is considered up.
No percentages to play around with.
Thank you
Ashok, That can certainly work if the customer is happy with it. I suspect that this customer would be better off with one more register, so that failure of a single register doesn’t cost them so much, but this depends on the cost/benefit tradeoff so is up to them.
Stuart
This has certainly worked because it is from an actual SLA done about 10 years ago
Good article Stuart, thanks for sharing.
The challenge though is how to automate this kind of measuring and outage reporting in the era of microservices and API economy.
Regards,
Beno
Benjamin, it certainly is a challenge. My preference is to go for something simple, rather than trying to create complex automation. Try to find a measure of business impact and apply it to all outages.
The problem here is that we are approaching the measurement of services to often just using availability as the primary indicator of performance. The reality is services provide a means of getting things done. So it stands to reason that we should measure services on their ability to get things done rather than just how available they are for getting things done. The consumers of services want things like transaction throughput and responsiveness/speed at the times they need to use the service. Just think of your internet connection at home – when you need to use it you want bandwidth and no lags in up/download speeds. The fact that it is available when you need to use the service is a given. The performance of the service when you needed is the paramount concern. It’s the same with IT services being consumed by business customers. Don’t get me wrong, we should still measure availability, but we do need more focus on service performance measurements that have better relevance to the consumers of these services.
You are absolutely right, but it is not just availability and performance that matter. One of my customers has “How quickly you responded to my ad-hoc change requests” as a KPI, because they are in an ever changing business and that is what matters to them.
Interested in your comments about transactions. Does anyone agree measuring Availability for a transaction processing service on the basis of failed v successful transactions is a valid approach? The point being that there are various cut off times throughout the day and if cut off is missed then the service isn’t being provided. Service Restoration time is kind of irrelevant as long as the service is available the next day to process transactions before the next cut off.
Great post. Thank you!
Sometimes it is difficult to pin-point the number of users affected.
Stuart, thanks for the article. I like table 2 but I do not necessarily agree with the number of users impacted story. First, it is often very difficult to quantify the number of users impacted. The first calculation that you stated provides no valuable information is, in fact, the undisputed metric of availability for the service in question during the reporting period. That 98% tells me more than the 98.96% that is reported when you include the number of users impacted. In fact, I often argue that the only purpose of including users impacted (an imprecise metric) into the calculation is to dilute the SLA percentage to something less severe. As an example, very recently, we had an outage of our VOIP telephone service for a few minutes. Fortunately, at the time of the outage, only 2 people were using telephony services and thus the outage was reported as a 5-minute outage but only for 2 users. I find that really hard to buy. Just by simple blind luck, our SLA reported was much better than what I would have reported it as – which is 5 minutes of outage PERIOD. The two people who were impacted where the CEO and one of his reports. Needless to say, they were not very happy and our reporting a stellar performance metric did not do anything to improve their confidence in the numbers being reported. Until there is a time where we are able to accurately and precisely measure who is impacted by a service outage, I believe teams should not try to dilute the calculation down with their guess of who is or should have been impacted … take the high road and assume everyone was impacted.
Buenísimo el articulo, un buen checklist de puntos a tener en cuenta.