Want to know more about visual asset dependency mapping? If so, then this article is for you. Please read on to find out more about why it’s essential for your datacenter along with the required steps – starting with the auto-discovery of assets – including six key benefits it delivers.
Auto-discovering Assets
The starting point for understanding any modern datacenter is auto-discovering its various assets. The discovered assets are then entered into a configuration management database (CMDB). These assets will include physical and virtual hardware and software.
Hardware auto-discovery should include compute, storage, and network devices, as well infrastructure components such as PDUs and cabling. Software auto-discovery should include operating systems, hypervisors, and applications.
There are two principles which are paramount for effectively using auto-discovery. The first is that the CMDB should be kept up to date. That means there should be the capability to regularly schedule auto-discovery so that it isn’t forgotten and doesn’t have to be done manually. The second is to make sure it’s comprehensive. In the modern datacenter, this can be a challenge.
Comprehensive auto-discovery requires multiple discovery tools and multiple discovery protocols such that you’re able to discover assets on premises and in the cloud. It must also be able to discover assets that are powered up and those that aren’t. And most importantly, it must be able to discover the relationships between the assets.
As an example, the auto-discovery capabilities built into a leading vendor’s CMDB uses 11 different discovery methods (with their associated protocols):
- Networking equipment (SNMP)
- V-servers
- Operating systems and hypervisors (WMI, SSH)
- Blade systems (SNMP)
- Cisco UCS Manager
- IPMI 623 (UDP)
- Ping sweep (ICMP)
- Power (UDP, Modbus)
- Active directory
- LDAP
- TCP
This brings us to visual asset dependency mapping.
Visual Asset Dependency Mapping
While capturing a snapshot of your datacenter’s assets in a CMDB is important, understanding their relationship to each other is more important. It’s these relationships that enable businesses to make informed decisions about their datacenter. Here, using Excel spreadsheets and Word documents to inventory datacenter assets makes it hard to capture these relationships and even more difficult to understand their impact on the business.
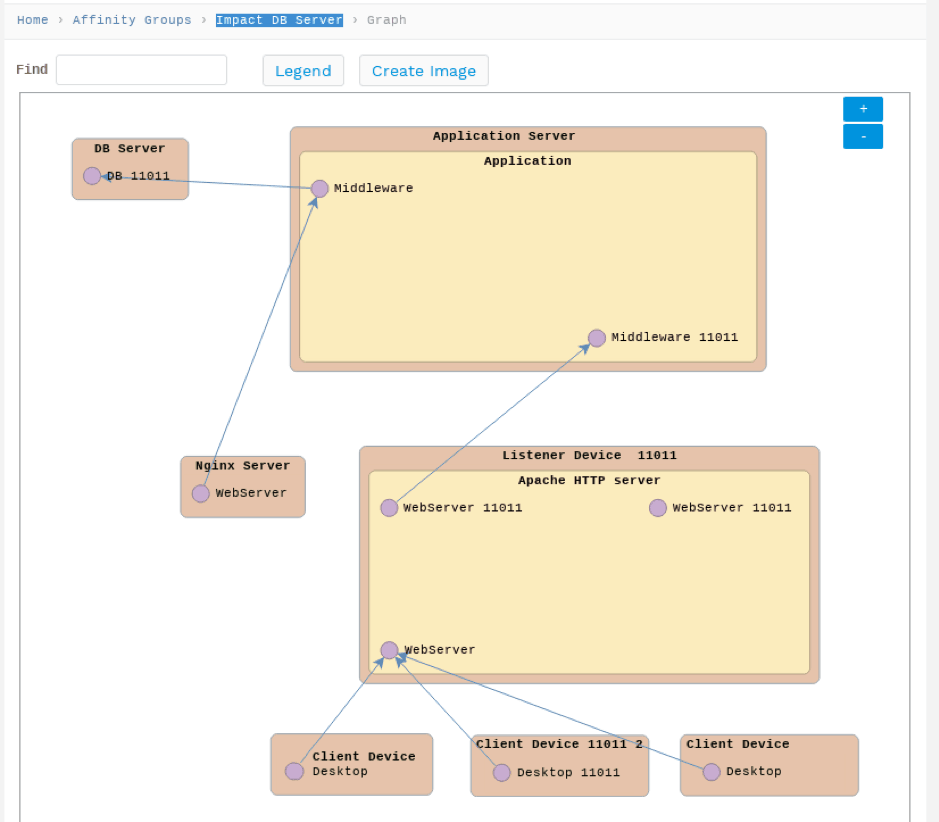
Once auto-discovery is complete, the next step is to create an impact chart. An impact chart is a tool used to visually map assets and the service connections between them.

An impact chart gives a holistic view of the entire enterprise and enables businesses to understand their assets’ operational dependencies.
A good impact chart reflects the comprehensive nature of the auto-discovery. For example, an impact chart should be able to display longitudinal dependencies from virtual hosts or blade chassis down to the virtual machines (VM) contained therein. Auto-discovery should also include a network impact chart to help visualize the relationships on layer 2.
Next, the six key benefits of visual asset dependency mapping…
1. Leveraging Asset Dependencies for Better Decisions
The real benefit to visual asset dependency mapping is how businesses can leverage the information within the maps (or charts) to make more informed decisions. The information available from visual impact charts can influence strategic decisions, as well as present opportunities to improve operational efficiencies and resiliencies.
2. Improved Troubleshooting with Visual Asset Dependency Mapping
One of the best operational uses for a visual asset dependency map is troubleshooting. When an outage occurs, or some resource is overburdened, the impact chart makes for a fast way to track down the source of the issue. Understanding how items communicate shows which hardware, software, and users are impacted, as well as what resources are available to alleviate the problem.
3. Better Asset Utilization
Dependency maps created via visual asset dependency mapping are a good way to understand asset utilization and, more importantly, underutilization. Detailed device information gathered from the assets can be used in datacenter growth planning to make informed decisions about where to prioritize investments. The information can also be used to decide which assets to consolidate and which ones to retire.
4. More Accurate Impact Analysis with Visual Asset Dependency Mapping
Whether growing, scaling-down, or migrating a datacenter, it’s nice to be able to quickly understand the trickle-down effect inherent in each asset. Understanding asset interdependencies empowers businesses to minimize disruptions from any planned change to the datacenter – and being able to visualize these interdependencies on an impact chart created via visual asset dependency mapping is what makes that possible.
5. More Robust Migration Planning
Asset dependency maps created from visual asset dependency mapping make migrations easier also. They can be used to ensure that no hardware, software, or services are overlooked. Planning for the move is facilitated by understanding the interdependencies.
6. Supporting Security Risk Analysis with Visual Asset Dependency Mapping
Visual asset dependencies maps have also been used to model information security risks in the datacenter. Experiments indicate that risk models which include asset dependencies have greater sensitivity than models that don’t.
Keeping track of datacenter inventory in spreadsheets and documents is no longer enough. Datacenters are too complex, too virtual, and too distributed. Neither is simply auto-discovering assets to populate a CMDB. The modern datacenter requires comprehensive and continuous auto-discovery. And it also requires mapping asset dependencies visually.
What other uses have you found for visual asset dependency mapping? Please let me know in the comments.
Carl Weisman
Carl Weisman, principal consultant and founder of Weisman Consulting, does copywriting for fast-growing technology companies including Device42. An engineer turned writer, he has authored four books including “The Essential Guide to RF and Wireless”.

