
In this article, I share what HappySignals has learned about the importance of employee or end-user experience management, in partnership with our customers, over the last five years. I also share what we’ve learned from the COVID-19 crisis and the increase in remote working.
For example, how are employees handling the new situation? Are they able to work? And what does IT support need to do differently?
Let’s start with a quick explanation of what employee experience management is.
What employee or end-user experience is
Over the last half-decade of working with our customers, we’ve discovered that there are two key facets of employee experience (and metrics to monitor):
- Employee happiness
- Employee lost productivity.
What has changed with end-user experience now many employees are working from home?
According to HappySignals data, there are now about 35% more IT incident tickets per day. We expect that the ticket volume will also remain high because the more technical and helpful colleagues in the office are no longer available to people. All IT issues, even the simpler ones, are now being sent to the IT service desk.
So, now there’ll be even more tickets, after all, people are alone and confused. They need help and your IT service desk has a lot to do. The good news is, we can all manage this if we focus on the most important things in the long run. And right now, the most important thing is to ensure that our employees can work efficiently and remotely.
According to @HappySignals data, since #COVID19 there are now about 35% more IT incident tickets per day. #ITSM Share on XTo help the IT support industry to understand this situation better, HappySignals has implemented a new survey that’s focused on remote working. Here are some of the initial findings based on 10,439 responses received between March 18th and March 30th, 2020.
The initial remote worker level of happiness with IT support stands at +39 compared to the global average of +67 for incidents and +75 for service requests. While this is concerning, it’s more important to understand what is and isn’t working in the support of remote workers. The following two charts show the negative and positive factors that are being reported:
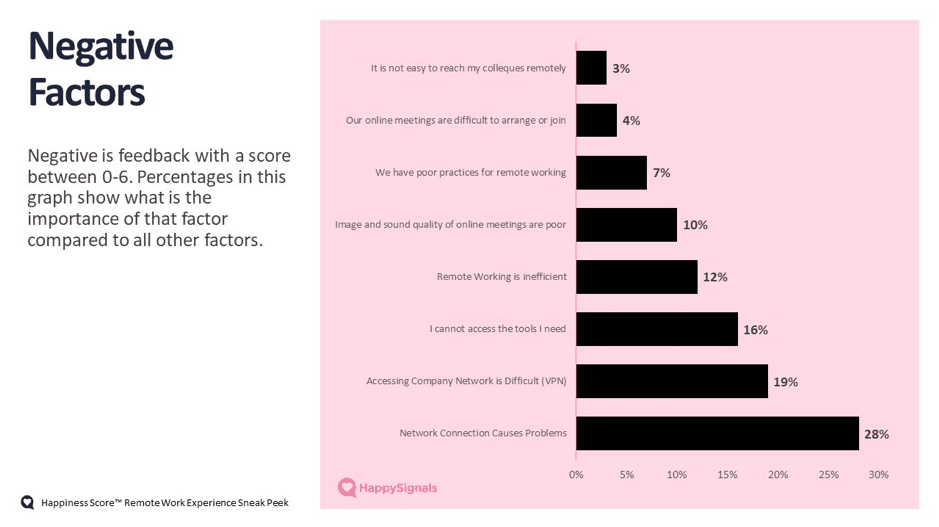
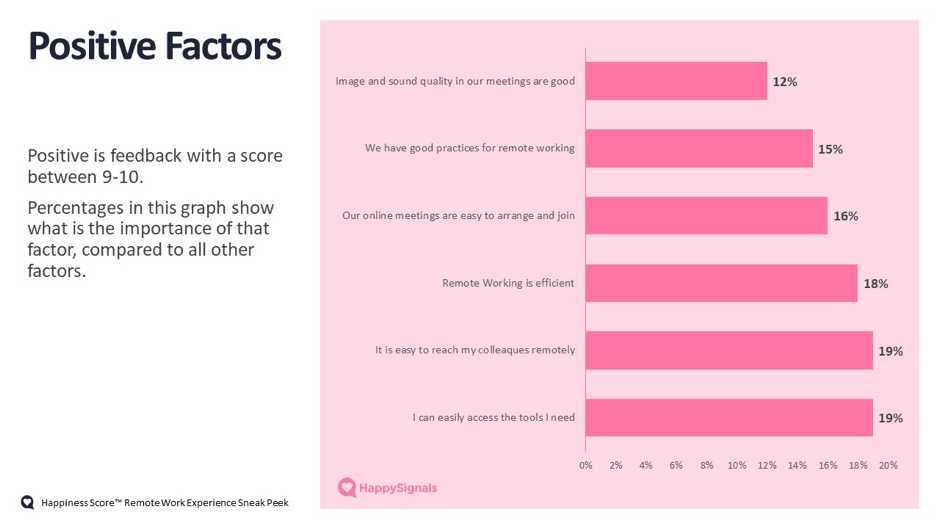
Please consider these factors in respect to how you’re currently enabling your organization’s remote workers and what likely needs to improve.
Network connection problems is currently the number one reason for IT disatisfaction amidst #COVID19 according to @HappySignals data. #servicedesk Share on XBeyond this new addition to our employee or end-user experience monitoring, hopefully you’ll find the following data and conclusions helpful too.
What makes employees like or hate IT support
We collect more than the happiness and lost productivity metrics for our customers though – for instance, the reasons for the relative state of employee happiness/unhappiness. Where our latest data shows the key causes of employee unhappiness, across all employees, to be:
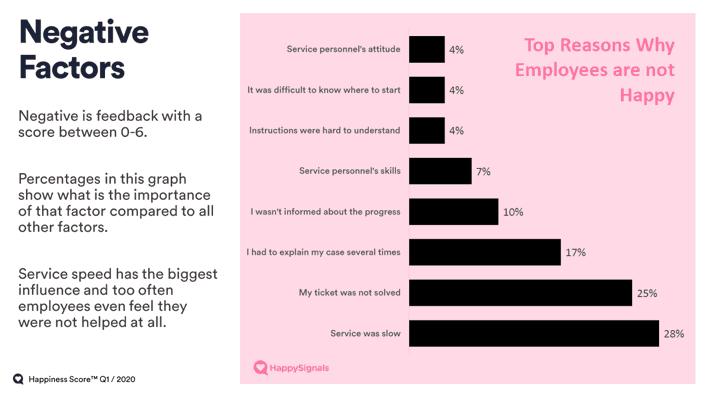
This chart is from our Happiness ScoreTM report, which also includes the factors driving both neutral and positive employee experiences.
Using end-user experience data to drive improvement
The employee happiness and lost productivity metrics are a great indicator of how well things are going with an IT service desk. Then the more-detailed data can be used to identify specific issues, the root causes, and improvement opportunities.
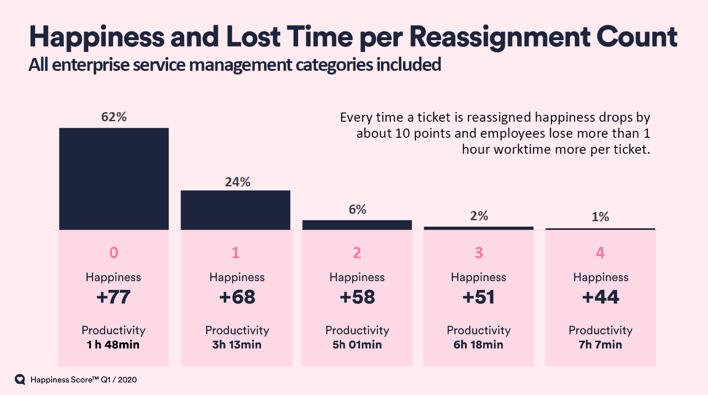
For example, the chart below shows the employee or end-user experience impact of reassignment, or “the ping-pong effect,” where an employee is passed between different analysts and even groups. You’ll notice how employee happiness and the level of lost productivity are both adversely affected by every reassignment. With a drop in happiness of 9 points and an extra hour and a half of lost productivity just from the first reassignment.
Another example is the difference – in terms of employee experience – between the service and support received from internal and outsourced IT service desks. The chart below shows that internal IT service desks are making employees 25% happier and 31% more productive than their outsourced equivalents.
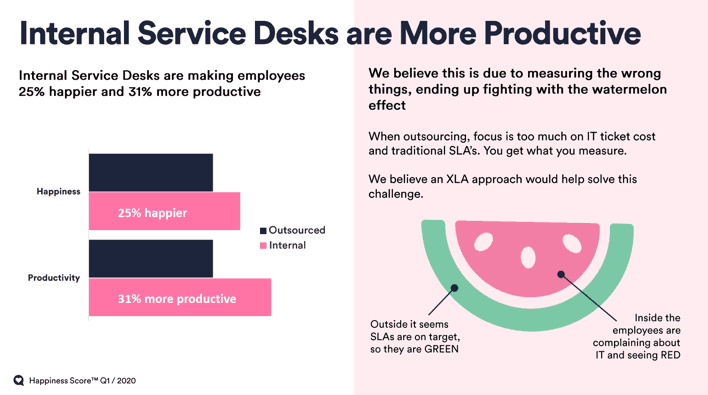
We believe that the cause of this delta is related to what’s usually measured relative to the outsourced contract and that the introduction of end-user experience level agreements (XLAs) would allow outsourced service providers to better focus on the right things for happier and more productive customer employees (and, consequently, happier customer organizations).
How the HappySignals Happiness Score report is created
This useful resource for anyone who works in IT service management (ITSM), or helps those who work in ITSM, anonymously aggregates the data from our customers. It highlights what they collectively do well, and what they don’t. Plus, we add commentary on the opportunities for organizations to better align with employee or customer expectations and the positive impact this will have on business results.
For example, any focused improvements to reduce the level of employee lost productivity will have a direct impact on the employees’ ability to work and the business outcomes they contribute to. Our data also shows that employee happiness is correlated with lost productivity, such that increasing employee happiness is going to improve business results.
For many, the real beauty of the Happiness Score report is the sample size – thanks to this being the sum of all our customers’ received feedback over a given period. For example, the chart below shows the employee or end-user experience for incident handling by contact channel.
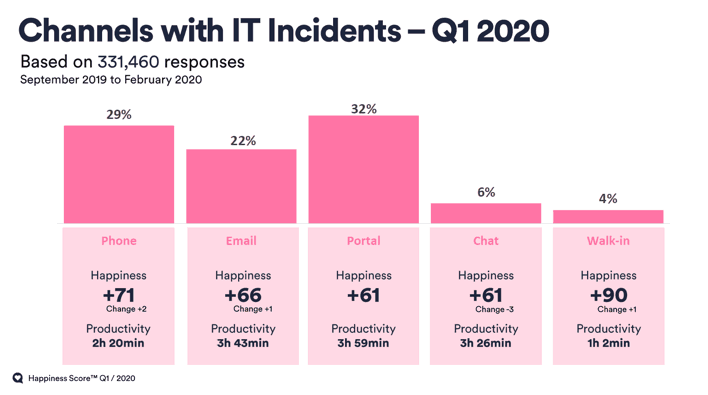
You’ll notice that the sample size is over 330,000 responses from organizations in over 130 countries who contribute to our benchmarks via the HappySignals Employee Experience Management platform. Hopefully, you’ll also notice that self-service portals provide both the lowest level of employee happiness (at +61) and the highest level of employee lost productivity at close to 4 hours.
It’s likely not what your organization expected when it invested in self-service technology to speed up service and resolutions to both save money and to deliver a better employee experience. I’d also bet that your current customer satisfaction questionnaire approach doesn’t deliver this type of valuable insight.
Taking employee or end-user experience beyond organizational boundaries
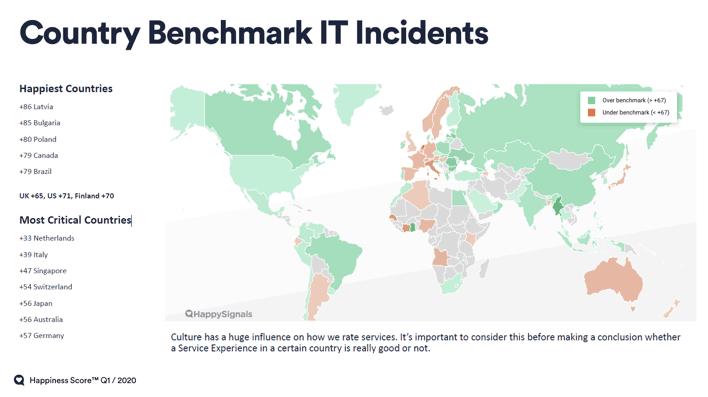
The above is just one example of how the collected data can be presented. We also offer profile-based views of employee happiness and country-based views. With the latter shown below (again it’s taken from the latest Happiness Score report).
We now also provide the respective level of employee happiness in enterprise service management scenarios. For instance, measuring how well other business functions – such as human resources (HR) – are dealing with employee issues and requests. This allows your organization’s business functions to learn from each other as well as other organizations around the world.
According to @HappySignals data, Latvia, Bulgaria, Poland, Canada, & Brazil have the highest employee happiness scores amidst #COVID19. #ServiceDesk Share on XGetting your free copy of the Happiness Score report
Hopefully, this article has opened your eyes to the value of employee experience and its measurement. Plus, how the quarterly Happiness Score report will help you.
To understand more, you can download the Q1 2020 Happiness Score report here. You can also watch an on-demand webinar that explains the Q1 report and its findings. Plus, if you wish to find out more about the remote worker findings, that can be accessed here.
Further Reading
Please use the website search capability to find more helpful ITSM articles on topics such as enabling business goals, managing customer experiences, customer service, continuously improving, managing mobile apps, developing team members, creating new products and services, users interactions with IT, day-to-day performance metrics, resolve issues with a great experience, making informed decisions, cost effectiveness, knowledge management and knowledge bases, how automation improves user experience, service delivery, improving business processes, and increased productivity.

Sami Kallio
Sami Kallio is the CEO of HappySignals, a company focused on helping businesses to improve their internal services by shifting the focus from traditional metrics to employee experience - by measuring and analysing employee happiness and productivity. Sami says:” I believe that enterprises should no longer try to save more money from support services. Rather that organizations should put more focus on business value. At HappySignals we help organizations to measure and understand their employees' experience and productivity in a new way."
