Let’s talk about duration report use. If you want to improve your IT service desk’s level of customer satisfaction and the customer experience (CX), you need to know where to start your improvement activity. For example, if you’re not meeting the response time agreements you have with your customers can you explain why? If not, then here’s a potential solution – duration distribution reporting is a strategy that service managers can use to gain a deeper understanding of the lifecycle of a request in your organization. Identifying the potential bottlenecks by reviewing how long requests stay in a certain status or with an operator group, to gain more control over your processes and outcomes.
Please read on to find out more about duration report use.
What is a duration report and how does it help?
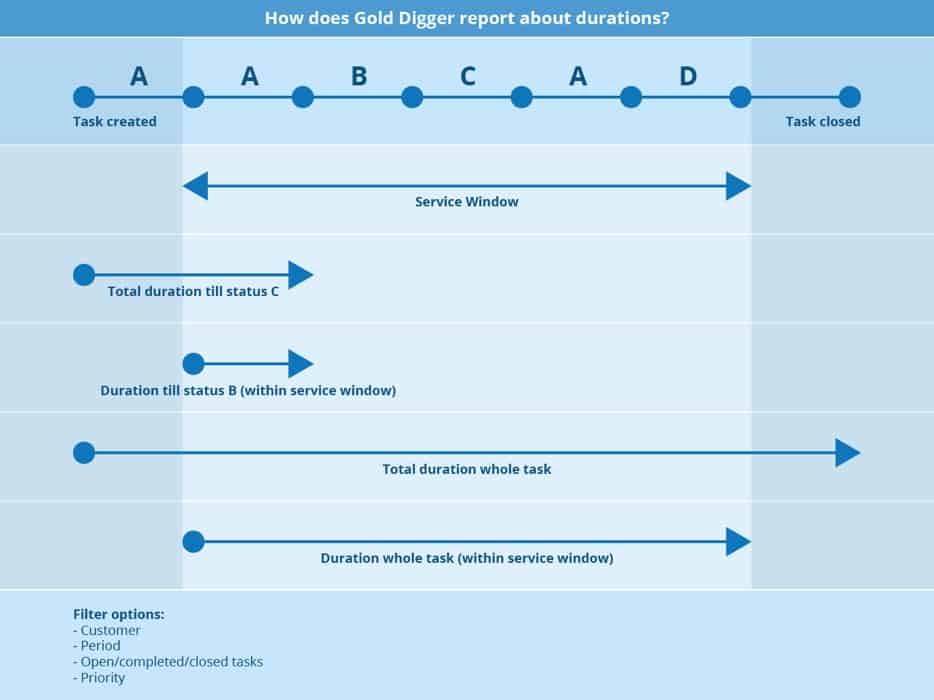
A duration report allows IT service desk members to look into how long it takes requests to progress to a specific stage (of the overall process). For instance, it shows you how long it takes before a call is set to a status for the first time.
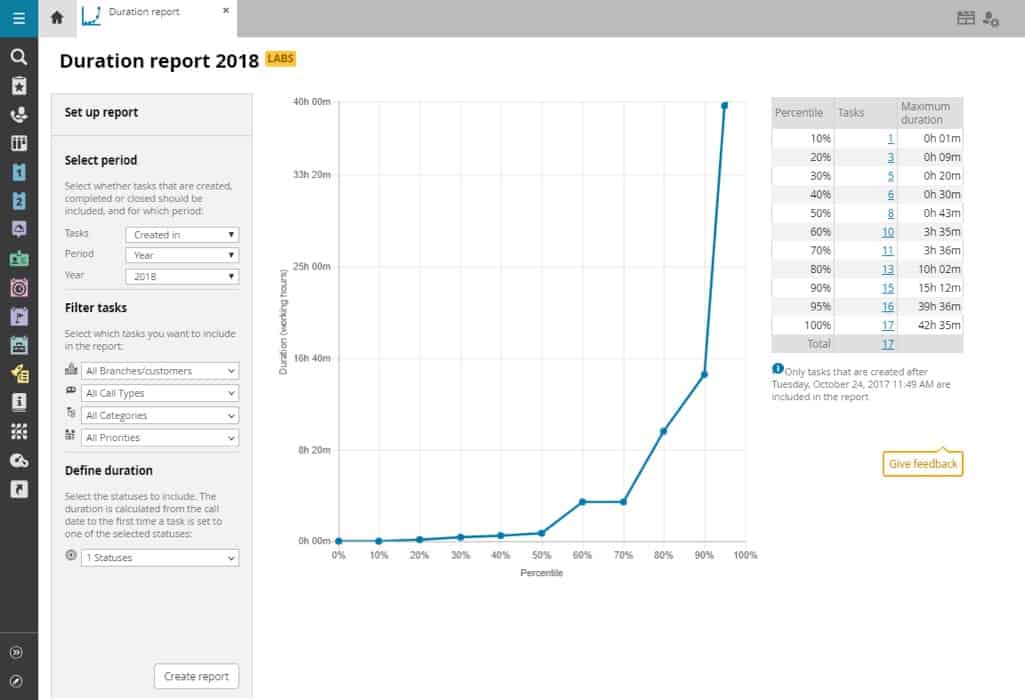
With these duration reports, you can see the maximum duration, or response times, of calls per percentile. This information then helps you to verify whether you’re meeting the agreements you have with your customers. Next, you’re able to dive deeper into your findings by using a second report – duration distribution.
Reviewing an IT service desk’s duration report will help you to gain a better understanding of how long, on average, your team’s requests stay in a certain status or with an operator group. For instance, you can check the total duration time that your operators work on a request, or the total duration that they’re waiting for a response from the customer, giving a clearer picture of the potential bottlenecks in your processes.
Using duration reports to enhance the customer experience
A duration report also can provide IT service management (ITSM) teams with greater clarity into why they’re not able to uphold service level agreements (SLAs) with customers.
For instance, an SLA target might be that the IT service desk is supposed to resolve requests within four hours. But, if you’re waiting on more information from the customer, how much time is this consuming.
Duration reports can help ITSM professionals respond to the needs of their customers relative the service agreements in place and whether these need to be adjusted or tweaked to better serve the customer’s needs (and to better meet their expectations). The same goes for your suppliers. Using the duration report, you will become more aware of how you’re working together with your suppliers.
Your ITSM tool’s out-of-the-box duration reports can be a powerful instrument in helping to improve your IT support processes, but much more can also be done with them. With additional valuable data available that can be of interest when inspecting your processes – with each change being made to an incident ticket creating a “snapshot” stored within your ITSM tool.
Managing service level agreements
If you’ve SLAs with your customers, your customers expect you to uphold them. With this first duration report (see below), you can see how long it takes before a customer’s request has its status changed for the first time. You can see the maximum duration times of requests per percentile. With this percentile, you can verify that you’re responding within the required time according to the SLA. For example, you can check that 90 percent of your customer’s requests have a response within X time.
What about requests that fall outside of that 90 percent? When you click through the requests that didn’t have an adequate response time, you can see what these calls have in common and a potential bottleneck becomes clear.
In the duration report, you can also choose which statuses are included. For instance, do you want to know how long a specialist group or supplier is involved in the request? Select the status in the report and you’ll see the duration of requests.
The duration reports are a way to further customize your call management process. The next step is a standard filter panel where service desk team members are able to filter results in the duration report by options, such as branch, priority, and category.
Although you can focus on tracking the status field, you’re also able to track based on operators which is important in identifying bottlenecks. For example, you’re able to evaluate if requests become stranded with certain operators or operator groups. Then if you can find a way to balance the load, and solve the request quicker, your customers will be more satisfied.
Besides the information you see in the duration report, you might also want to access the raw data. Because duration reports provide the ability to review raw data in an easily accessible and standardized way and, with this data, IT service desk teams are able to create more extensive duration reports – suited to their own business needs – using their preferred business intelligence solution.
Does your IT service desk already use duration reports to improve customer satisfaction and the customer experience? If so, please let me know how in the comments.
If you liked this Duration Report article, you might also like these other IT service desk articles.
Nancy Louisnord
Nancy Louisnord is the Global Chief Marketing Officer of Manta, responsible for the company’s global marketing programs and product marketing strategy. With more than 15 years of international leadership experience in the B2B IT SaaS industry, she is a sought-after presenter at conferences and one of HDI’s TOP 25 Thought Leaders and HDI’s featured contributors. Manta offers a comprehensive data lineage platform that gives companies complete visibility and control of their data pipeline. Manta has helped companies reduce incidents through proactive risk analysis, accelerate digital transformation, and enhance governance by building trust in data.


