
I’ve always been a lover of numbers and statistics. And this is no different in an IT service management (ITSM), ITIL, and IT service desk context. For instance, it’s great to know that, on average, an IT service desk agent will spend 7 minutes dealing with a telephone call (but please don’t take this as gospel, as explained below). Or that many IT service desks aim to achieve, but fail to meet, a 70% first-contact resolution (FCR) level. But how should your IT organization be employing such helpful statistics? Please read this article to better understand some of the cons, that sit alongside the pros, of such IT service desk benchmarks.
The Availability of IT Service Desk Benchmarks
There are a variety of sources for such benchmark data, including:
- Companies that specialize in benchmark data – for instance, MetricNet
- ITSM tool providers that anonymously aggregated customer data and make this available to customers as helpful benchmarks
- The results of IT support professional membership organization surveys such as the Service Desk Institute (SDI) Service Desk Benchmarking Report and HDI’s annual Technical Support Practices & Salary Report – where data is usually free to access (probably via email registration).
All of which can be helpful in understanding where your organization is and what it can improve upon.
So, What Does the Average IT Service Desk Achieve?
The following benchmark tables are taken from the 2017 SDI Benchmarking Report (hopefully, the 2019 version is due soon), with each table of metric data offering both insight and further questions.
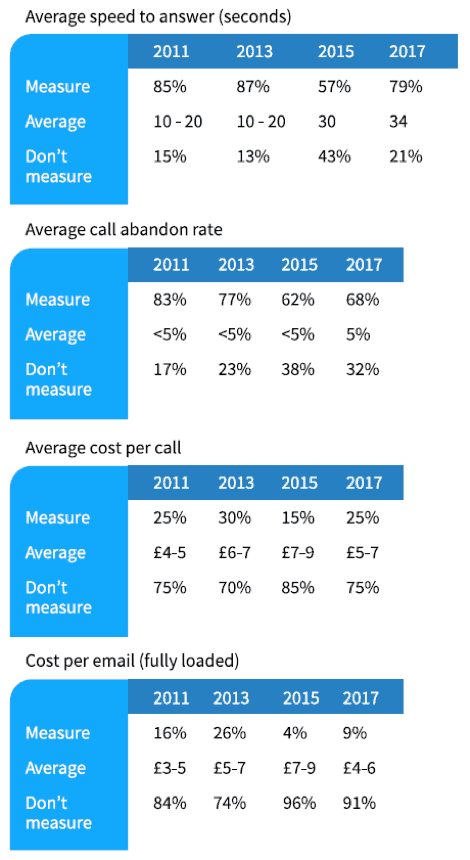
Looking at Table 1 first, and starting with “average speed to answer” – the obvious question is: Why was there dip in metric usage in 2015? The most likely answer is that there wasn’t, with the drop probably caused by a change in the makeup of the survey sample.
For instance, if more survey takers work for smaller organizations, then there could be a lesser focus on metrics per se (including those that relate to the performance of the telephone channel). Looking at the other metrics in Table 1, there’s a similar dip across every measure for the 2015 results. Although this is not replicated in Table 2.
Table 1: If measured, what are your average metrics?
Think About: Organizational Suitability
The above dip is an indication of the first “con” of benchmarks. That, while it’s great to have access to such statistics, it’s important to understand whether the benchmarks are well-suited to your organization’s operations.
The “average cost per call” and “cost per email” benchmarks shown above are great examples of this – with the cost of both increasing in 2015 before dropping again in 2017 (again probably due to a higher proportion of smaller organizations being involved in the survey).
And applying these benchmarks to your organization, if you’re a:
- Small organization looking at the 2017 “average cost per call” of £5-7, then you’ll most likely struggle to achieve this (because you won’t benefit from the size-based economies of scale that influence this benchmark cost)
- Large organization looking at the 2015 “average cost per call” of £7-9, then you might mistakenly feel you’re doing better – in terms of cost management – than you actually are.
Think About: Other Parameters That Influence Relevance
This is the second “con” – the timeliness, and thus accuracy, of benchmark information.
For instance, the 7 minutes I mentioned at the start of this article is from five-plus years ago – so is it still relevant given the advances in ITSM tool, and operational, capabilities? So, it might be relevant to your organization, but perhaps not since 2014!
But this is not only dependent on the already-mentioned size of the organization and the benchmark’s age but also:
- The capabilities of the IT service desk, such as the best practices and labor-saving technologies employed. Plus of course the experience of staff. Sometimes your IT service desk will never be able to meet a benchmark target with the limited resources it has available.
- The mix of incident and request types. For instance, due to complexity, your organization’s average handling time might be 20 minutes and there’s no chance that it will achieve the same cost level as an organization where the average handling time is only 5 minutes (due to the relative simplicity).
The benchmarks included in Table 2 also show a different change. This time, rather than a dip in 2015, there’s a dip in 2017 results. With the percentage of organizations that measure:
- FCR usage dropping from 79% to 64%
- “The number of incidents logged” metric usage dropping from 97% to 79%
- “The number of service requests logged” metric usage dropping from 72% to 51%
Table 2: If measured, what are your average metrics?
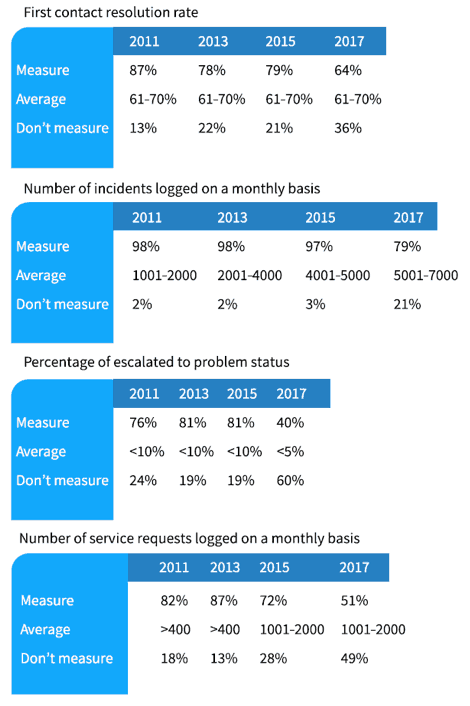
Does this mean that these common IT service desk metrics (and benchmarks) are falling out of favor? Probably, not – and it’s important not to assume that this is true.
Think About: Checking/Using Multiple IT Service Desk Benchmarks Data Sources
So, rather than considering the above SDI data points – or any other single source of benchmarking data – as gospel, seek out different benchmark datasets to corroborate the benchmarks you wish to use. For example, the 2018 version of the aforementioned annual HDI report, which has a predominantly North American focus.
Looking at this HDI data, we can start to feel better about certain benchmarks and more “suspicious” of others. For instance, starting with the latter, the 7-minute handling time I initially quoted is less than the 8-10 minutes (for telephone incidents) in the HDI data. But, having just Googled it, this MetricNet and HDI paper from 2012 shows a 7-minute median. With this perhaps a good example of how benchmarks will change over time.
There are many similarities though. For instance, the HDI “average speed to answer” of 21-30 seconds seems to mirror the increase in the SDI data – where IT service desks are now taking longer to answer calls. Or FCR which is 64% in the HDI data and 61-70% in the SDI data versus the oft-quoted IT service desk target of 70%. Or the phone abandonment rate, which is 5% in both HDI and SDI data.
To summarize, benchmarks can be powerful tools in understanding how well your IT service desk is performing and for the identification of improvement opportunities. But it’s important to remember that a single benchmark, or a set of benchmarks, might cause you more harm than good if you’re trying to compare apples with oranges (or apples with apples that are “past their prime”). So please use benchmarks wisely and with care.
If you liked this IT Service Desk Benchmarks article, would you like to read another IT service desk article?

Stephen Mann
Principal Analyst and Content Director at the ITSM-focused industry analyst firm ITSM.tools. Also an independent IT and IT service management marketing content creator, and a frequent blogger, writer, and presenter on the challenges and opportunities for IT service management professionals.
Previously held positions in IT research and analysis (at IT industry analyst firms Ovum and Forrester and the UK Post Office), IT service management consultancy, enterprise IT service desk and IT service management, IT asset management, innovation and creativity facilitation, project management, finance consultancy, internal audit, and product marketing for a SaaS IT service management technology vendor.
